
FORECAST LITERACY
How to read the new SPC outlook maps.
Since March 3, 2026, the Storm Prediction Center’s severe weather outlooks carry Conditional Intensity Groups in place of the old hatched area. The risk colors did not change. The hatching now means something more specific.
The short answer
The five risk categories, Marginal (1) through High (5), work the way they always have. The patterns laid over the tornado, wind and hail maps are Conditional Intensity Groups, also called Intensity Levels 1 to 3. They answer a different question from the colors: if a tornado, damaging gust or large hailstone does happen here, how strong could it be? An Intensity Level can appear even where the chance of severe weather is low.
Two different questions in an SPC outlook
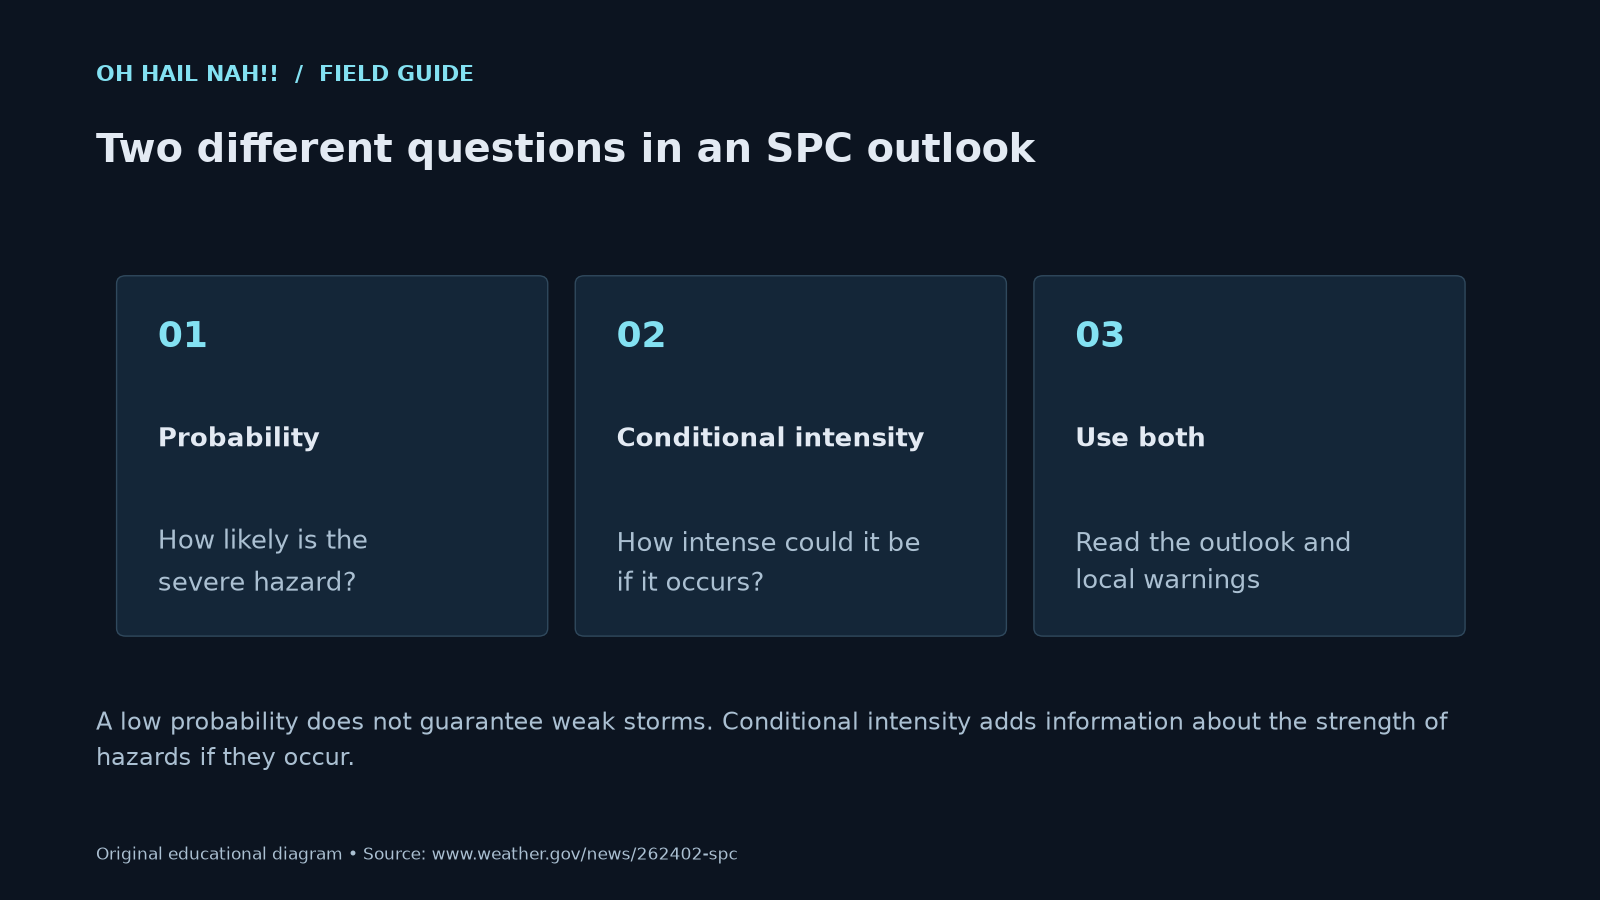
A low probability does not guarantee weak storms. Conditional intensity adds information about the strength of hazards if they occur.
What changed on March 3, 2026
For years, the Storm Prediction Center drew a single hatched area on its hazard maps wherever it saw at least a 10 percent chance of significant severe weather within 25 miles: a tornado rated EF2 or stronger, wind of 75 mph or more, or hail 2 inches or larger. The hatching was on or off. It could not tell a day with a few strong tornadoes from a historic outbreak.
Starting with the 1630 UTC Day 1 outlook on March 3, 2026, SPC replaced that hatched area with up to three Intensity Levels for tornadoes and wind and two for hail, on the Day 1, 2 and 3 outlooks. The categorical map also got a visual refresh, with labels moved from the image into a legend.
What did not change: the categories. SPC built the new rules for turning probabilities into categories to match its historical practice, so an Enhanced or Moderate risk in 2026 means about what it meant in 2025, and each should show up about as often.
The three patterns
Dashed lines, upper right to lower left.
Solid lines, upper left to lower right.
Solid cross-hatching.
Illustrations of the pattern styles described in SPC’s rollout. Always check the legend on the outlook itself.
What each level means
Each level describes the strongest events the environment could reasonably support if storms form and turn severe.
| Level | Tornado | Damaging wind | Hail |
|---|---|---|---|
| No pattern | Mostly EF0 to EF1 expected | Gusts mostly under 75 mph | Mostly under about 2 inches |
| Level 1 | EF2 or stronger possible | Gusts of 75 mph or more possible | Around 2 inches or larger, typically from supercells |
| Level 2 | EF3 or stronger possible | Bow echoes or a derecho possible | Around 3 inches or larger, typically from long-lived supercells |
| Level 3 | EF4 or stronger possible; reserved for potential historic outbreaks | High-end derecho, usually one already underway | Not used for hail |
Summarized from SPC’s rollout materials and NWS and broadcast meteorologist explainers. Exact definitions are published by SPC.
Why the levels key on EF2, EF3 and EF4
Strong and violent tornadoes cause most of the harm. SPC notes that tornadoes rated EF3 or higher account for 88 percent of tornado deaths and 75 percent of injuries. SPC calibrated each Intensity Level so that a larger share of the tornadoes inside it are strong ones:
Share of tornadoes that are strong, by Intensity Level
SPC’s target distributions for each Conditional Intensity Group
- Rated EF2 or stronger
- Rated EF3 or stronger
Show as a table
| Intensity Level | EF2 or stronger | EF3 or stronger |
|---|---|---|
| No pattern | 7% | ~1% |
| Level 1 | 20% | 6% |
| Level 2 | 30% | 12% |
| Level 3 | ~40% | 19% |
Read that carefully. Even inside Level 3, most tornadoes are not violent. The level tells you the environment can produce the rare, destructive ones, which is what should change your plans.
How to read an outlook, step by step
- Start with the category color. Marginal (1), Slight (2), Enhanced (3), Moderate (4) or High (5) is the overall severe risk for the day.
- Open the hazard maps. Days 1 and 2 have separate tornado, wind and hail maps. Day 3 has one combined severe map, because uncertainty is greater that far out.
- Read the probability contour. The percentage is the chance of that hazard within 25 miles of a point.
- Look for a pattern. If your area is inside one, the environment could support stronger-than-usual events if storms form.
- Check the valid time, then check again later. The Day 1 outlook is updated through the day as new data arrives.
Low chance, high ceiling
The biggest change is that SPC can now flag a dangerous setup even when storms may be few. Picture two towns, both inside a 5 percent tornado contour. Only one sits inside a Level 1 pattern. A tornado is no more likely in that town. But if one does form nearby, the environment could support an EF2 or stronger. During the experimental period, SPC drew a Level 1 area where tornado probabilities were only 5 percent.
The reverse happens too. A line of storms might be expected to produce many damaging wind reports but few extreme gusts. That day could show high wind probabilities with no pattern at all.
“Now, even when the probability of a severe hazard is low but the intensity is high, we can convey that threat,” said Evan Bentley, warning coordination meteorologist at the Storm Prediction Center.
What an Intensity Level is not
- Not a prediction that a strong tornado will happen. It is conditional on severe storms forming.
- Not a watch or a warning. Outlooks cover days and broad areas. Watches cover hours. Warnings cover a storm headed for you right now.
- Not street-level. The 25-mile probability means the whole area shares the risk.
Warnings are what you act on. If the outlook shows a pattern over you, use the extra lead time to make sure your alerts can wake you and your shelter plan is ready.
Where it came from
SPC first tested intensity forecasts at the 2019 Spring Experiment in NOAA’s Hazardous Weather Testbed in Norman, Oklahoma. Forecasters produced them internally from late 2021 until the public launch, using more than four years of real events to show they could tell intensity levels apart.
Questions people ask
Did SPC get rid of the hatched area?
Yes. Since March 3, 2026, the single hatched “significant severe” area has been replaced by Conditional Intensity Groups, shown as up to three hatching patterns for tornadoes and wind and two for hail on the Day 1 to 3 outlooks.
Do Intensity Levels change the Marginal to High risk categories?
The categories are still Marginal, Slight, Enhanced, Moderate and High. SPC now combines probabilities with conditional intensity to set them, but designed the conversion to match its historical practice, so each category should mean about the same thing and appear about as often as before.
What does Intensity Level 1 mean for tornadoes?
It means that if tornadoes occur in that area, the environment could support tornadoes rated EF2 or stronger. It does not mean a tornado is likely.
Is there an Intensity Level 3 for hail?
No. Hail uses two levels: Level 1 for hail around 2 inches or larger and Level 2 for hail around 3 inches or larger.
Which outlooks show Intensity Levels?
The Day 1, Day 2 and Day 3 Convective Outlooks. They also appear in SPC’s machine-readable outlook data, where they replaced the old SIGN label.
Keep reading
Sources
- National Weather Service, SPC’s Conditional Intensity shines a light on the most violent weather.
- NOAA Storm Prediction Center, Conditional Intensity in SPC Convective Outlooks (target tornado distributions).
- The Weather Channel, Severe weather forecasts from NOAA are being tweaked.
- MemphisWeather.net, SPC convective outlooks to add intensity potential (pattern styles).
- WFMJ, Weather 101: Severe weather communication and CIGs.
- KIMT, SPC introduces conditional intensity to severe weather outlooks.
These guides support personal planning. They do not replace official warnings, emergency services or local evacuation orders. When a warning is in effect for you, act on it first and read later. Official forecasts and warnings: weather.gov.
